
From where come the Brazilian open-source contributions?
Some days ago I was wondering why open-source communities are so cool! You can meet a lot of interesting people, who devote a lot time of their time-lifes just to create stuffs that other people will use. It is strange. Usually, this people actually have their own business, work, family, whatever, and they still find time to work for free. It sounds weird to me (even though I devote part of my time to open-source activities).
But, the point is: how active these communities are? And if you take into consideration only the Brazilian community, what is the general picture that we can drawn from they? Thinking about it, I collected a lot of data about Brazilian developers in the github social coding website. There is a lot of interesting findings.
1. Are the brazilian open-source community active
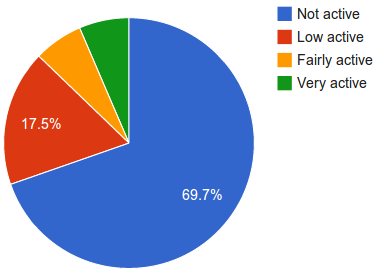
Not as I expected. I gathered data for a total of 4.481 users, which 3.121 ones do not have any kind of contribution. That is, 30% of the users (the active group) are responsible for 100% of the contribution. The active group was sub-divided in more three groups: low active (up to 19 contribution per year), fairly active (up to 49 contributions per year) and very active (more than 49 contributions per year). Furthermore, the percentage of the low actives, fairly actives and very actives are, respectively, 57.8%, 20.9%, 21.3%. The Pareto’s principle also works here: from 30% of the users come the 100% of the contributions. This results show us that the brazilian open-source community is not so active as we may guess.
2. From where they come?
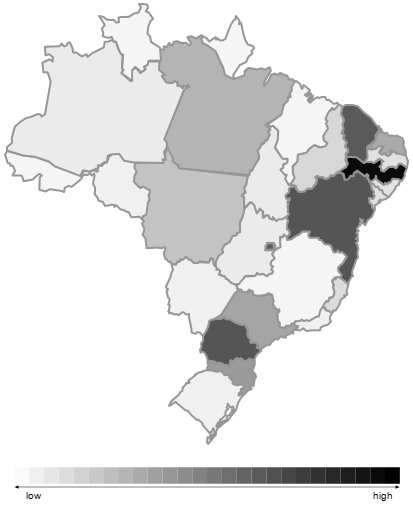
If we take into consideration the user locale, we observed that 46% of these users come from the Northeast region, which is very interesting, since, here in Brazil, the most economical region (or, in this case, from where have the most job offers) is the southeast region. If we take into consideration the specific State, the most active are Paraná (13.65%), followed by Ceará (12.37%) and followed by (11.25%). All theses states are not part of the southeast region. Nonetheless, this kind of analysis is very difficult to perform, since the user can omit the location field (which represents 8% of the total), provide unreliable information, or use acronym, nicknames, etc. But, if we can draw a chart of the Brazilian open-source contribution per state, it may look like this one.
3. Which are the most popular programming languages?
Github can infer the most used language on a given project. Then, analyzing the set of projects contributed, the list of the ten more used programming language are: JavaScript (22.77%), Ruby (18.78%), Java (14.19%), PHP (13.95%), Python (9.86%), C (3.36%), C++ (2.94%), Shell (2.55%), Objective-C (1.95%) e C# (1.88%). I have to tell that these results surprised me a bit. Since I’m a Java-guy, my heart used to fell that Java is the most popular language in Brazil. But, it seems that Brazilian hackers are more likely to use untyped languages, such as JS, Ruby, PHP, although the Java language remains in the top-3. It is cool.
Now I’m wondering if these data are only related to github, or if it could be possible to generalize. Someday I want to correlate this result with stackoverflow, or other similar forge.
If you want to read more about, please check out our paper.